Bitcoin price is once again caught in the crossfire of global geopolitics. As President Donald Trump raises U.S. tariffs on Chinese imports to a staggering 145%, investors are scrambling to figure out how this economic warfare could ripple across the crypto market. Bitcoin, often viewed as a hedge against traditional market chaos, saw brief volatility spikes but the charts reveal a much deeper story. Is BTC price on the edge of a breakout, or are darker days ahead?
Bitcoin Price Prediction: How Are Tariff Wars Impacting Bitcoin’s Sentiment?
The latest trade escalation — a massive hike in duties on Chinese goods and the exclusion of China from a 90-day global tariff pause — has reignited fears of a full-blown trade war. In previous macro cycles, such tensions have pushed investors toward “harder” assets like gold and, increasingly, Bitcoin. However, the reaction this time is mixed.
While Bitcoin price briefly popped above $81,000, market sentiment remains cautious. Unlike previous geopolitical moves that triggered FOMO rallies in BTC price, the current atmosphere feels heavy with uncertainty. Traditional markets are wobbling, and Bitcoin price is now straddling the line between safe haven and high-risk asset — a narrative tug-of-war that’s clearly playing out on the charts.
What’s the Daily Chart Telling Us About the Trend?
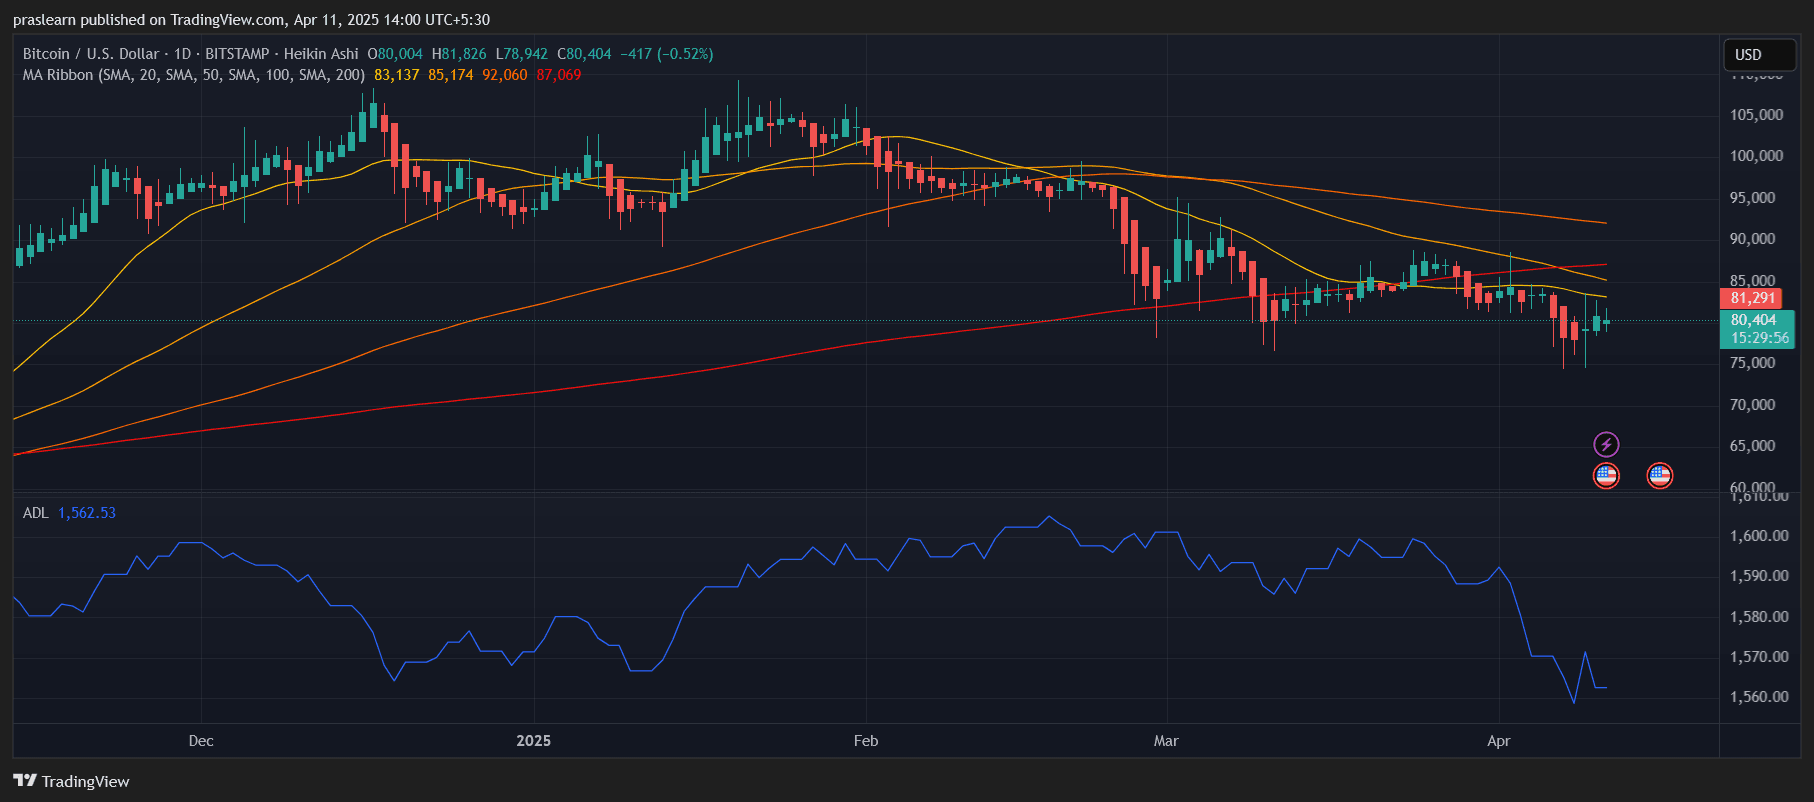
On the daily timeframe, Bitcoin is showing signs of indecision. The price has pulled back from the March highs and is now consolidating around $80,400, slightly below the 20-day SMA ($83,137) and 50-day SMA ($85,174). These moving averages are currently acting as resistance, and unless broken decisively, the trend remains vulnerable to downside.
The 200-day SMA, sitting around $87,069, is still sloping upward, suggesting that the long-term trend is intact. However, the Heikin Ashi candles are showing a mix of smaller bodies with long wicks — a clear indication of choppy, range-bound trading and lack of strong directional conviction.
The Accumulation/Distribution Line (ADL), while not falling off a cliff, has gradually declined to 1,562.53, hinting at reduced participation from long-term buyers. In short, Bitcoin’s daily chart is stuck in a holding pattern, and the next move will likely be triggered by a macro jolt — possibly another tariff escalation or a surprise shift in Fed policy.
–> Wanna trade Bitcoin? Now is the perfect time, especially that the market is consolidating before a volatile period. Click here to open an account with Bitget using our link and benefit from 100% transaction fee rebates in BGB on your first transaction <–
Is the Hourly Chart Hinting at a Rebound?
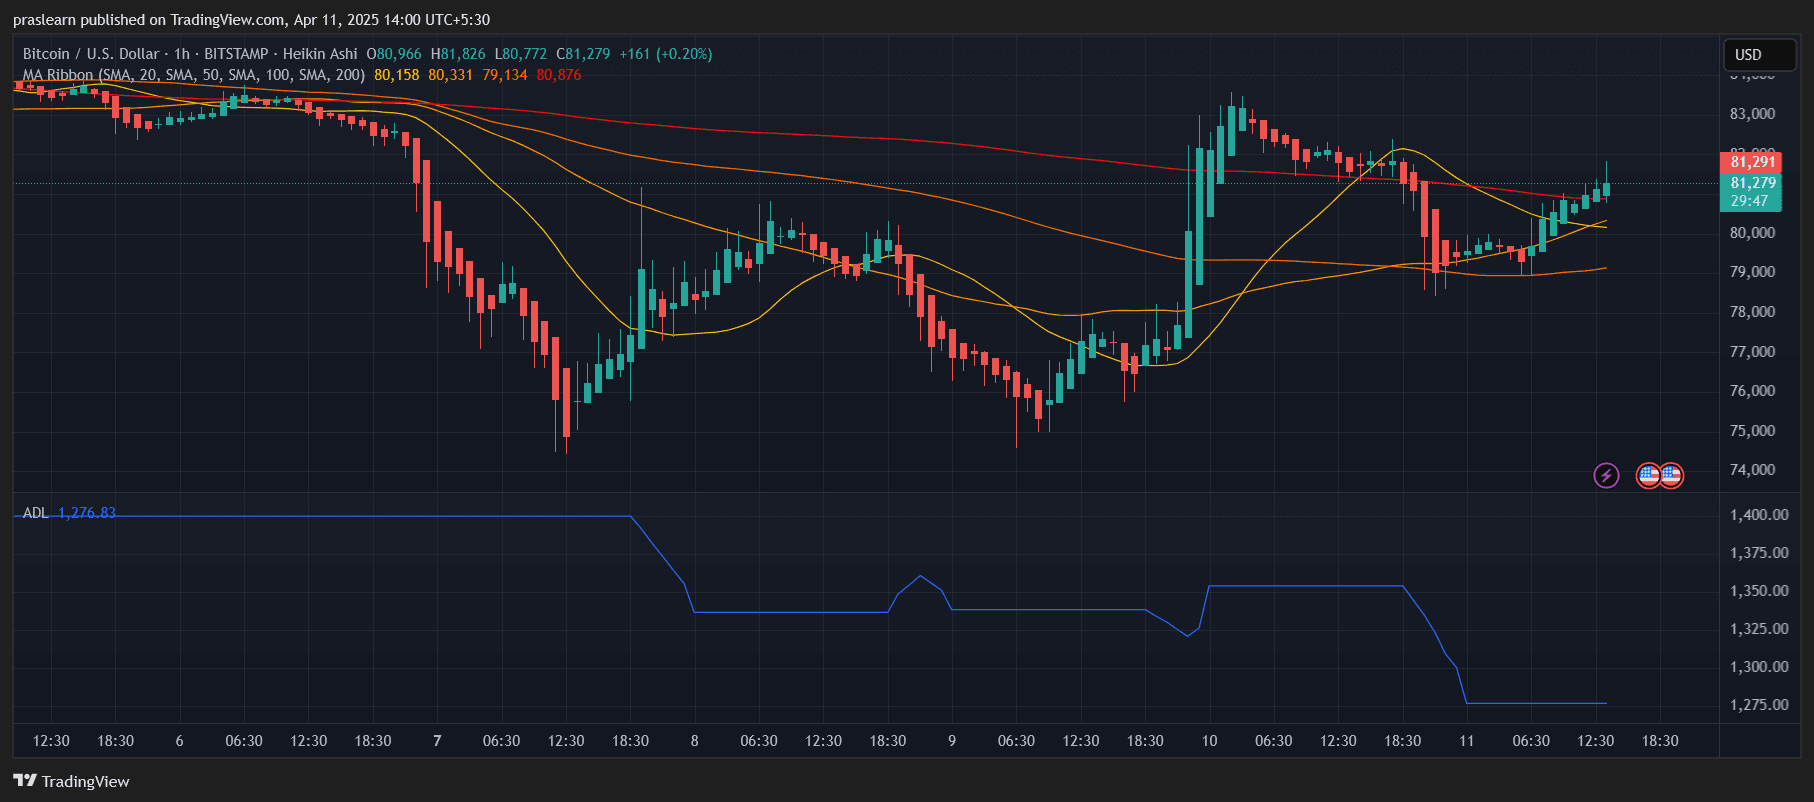
Zooming into the hourly chart gives a clearer view of near-term price behavior. Bitcoin is currently bouncing back from recent lows and has reclaimed the 20-, 50-, and 100-hour SMAs, trading around $81,279. The big test is the 200-hour SMA at $80,876, which BTC just climbed above — a short-term bullish signal.
The structure suggests a rounded bottom formation, which typically precedes an upward continuation if volume supports the move. However, the ADL on the hourly chart has dipped to 1,276.83, a clear red flag that recent price gains may lack conviction from institutional or large-scale buyers.
Short-term traders will be watching closely for a confirmed hold above $81,000. If BTC can flip the $83,000–$85,000 range into support, a push toward $90K is back on the table. But failure to maintain the current bounce could result in a pullback to $78,000 or even $75,000, especially if traditional markets react poorly to further tariff news.
Is Bitcoin Still a Safe Haven Amid Global Chaos?
Historically, Bitcoin has gained when fiat confidence declines — like during inflation surges or government instability. But trade wars are a trickier beast. They introduce uncertainty without always triggering immediate financial system collapse. For Bitcoin to benefit, investors must shift from risk-off assets like bonds to crypto — a transition that hasn’t fully materialized yet.
What’s different this time is the magnitude and pace of the tariff escalation. A 145% total duty is no longer just posturing — it’s real economic pressure. If this leads to retaliation from China or supply chain disruptions, Bitcoin could rally as capital seeks alternative hedges. But if panic sets in across global markets, BTC might sell off along with everything else.
Bitcoin Price Prediction: What’s Next for Bitcoin Price?
Bitcoin stands at a macro and technical crossroads. The hourly chart hints at recovery, but the daily chart shows resistance walls that won’t crumble easily. With Trump’s tariff shock shaking investor confidence and no clear safe-haven narrative emerging yet, BTC could remain volatile and range-bound in the short term.
For now, all eyes are on $83,000 — a breakout level that could signal a resumption of the bull run. But until that happens, Bitcoin traders should expect turbulence and remain cautious, especially if U.S.-China tensions continue to escalate.