Another surprise in the tariff outlook coupled with more evidence of accelerating inflation is boosting stagflation fears.
Last Wednesday, President Trump announced a 25% tariff on imported vehicles and auto parts. The move, which has been described as “permanent”, is meant to incentivize car companies to produce vehicles in the U.S.
The new auto tariff comes just ahead of fresh reciprocal tariffs that could be announced on goods imported from major trading partners including China, Canada, and Mexico.
Surveys on consumer sentiment continue plunging as uncertainty over the economic outlook grows more clouded. The final reading on the University of Michigan’s consumer sentiment survey dropped to 57 for March. That’s a nearly 12 point drop from the prior month, and is the lowest reading since November 2022.
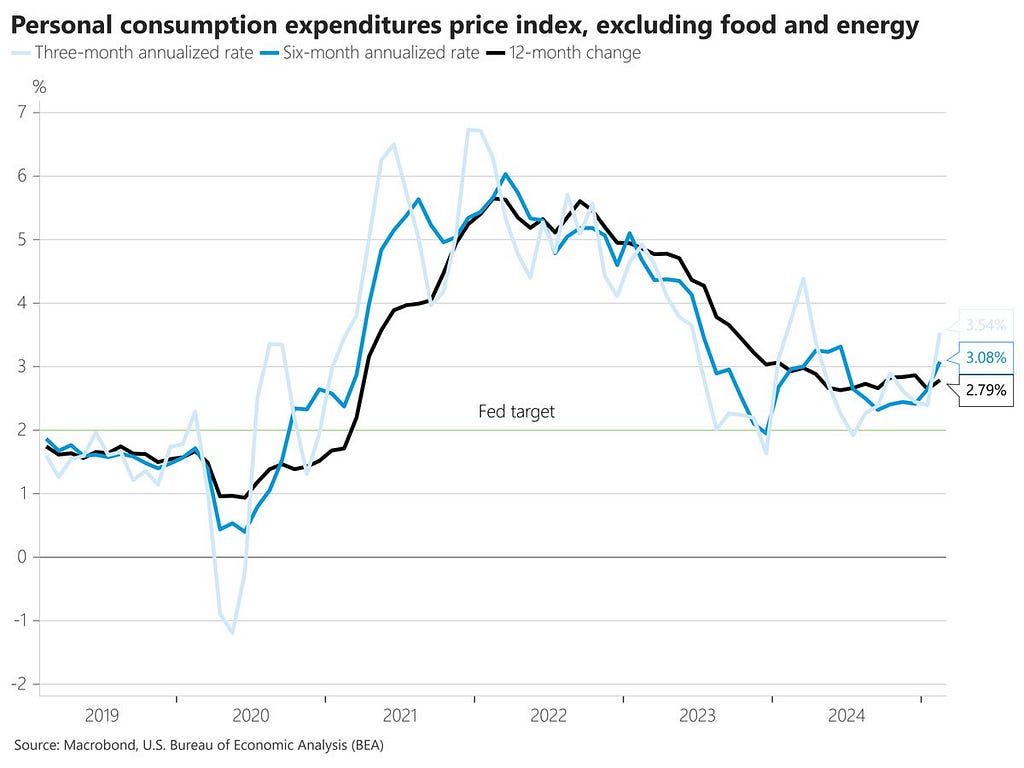
At the same time, more evidence is emerging that inflation is already accelerating before tariffs hit. The personal consumption expenditures price index (PCE) increased by 2.8% year-over-year in February.
The core measure that strips out food and energy rose more than expected as well. You can see annualized rates of core inflation over the 3-, 6-, and 12-month lookback periods are all rising and well above the Federal Reserve’s 2% inflation target.
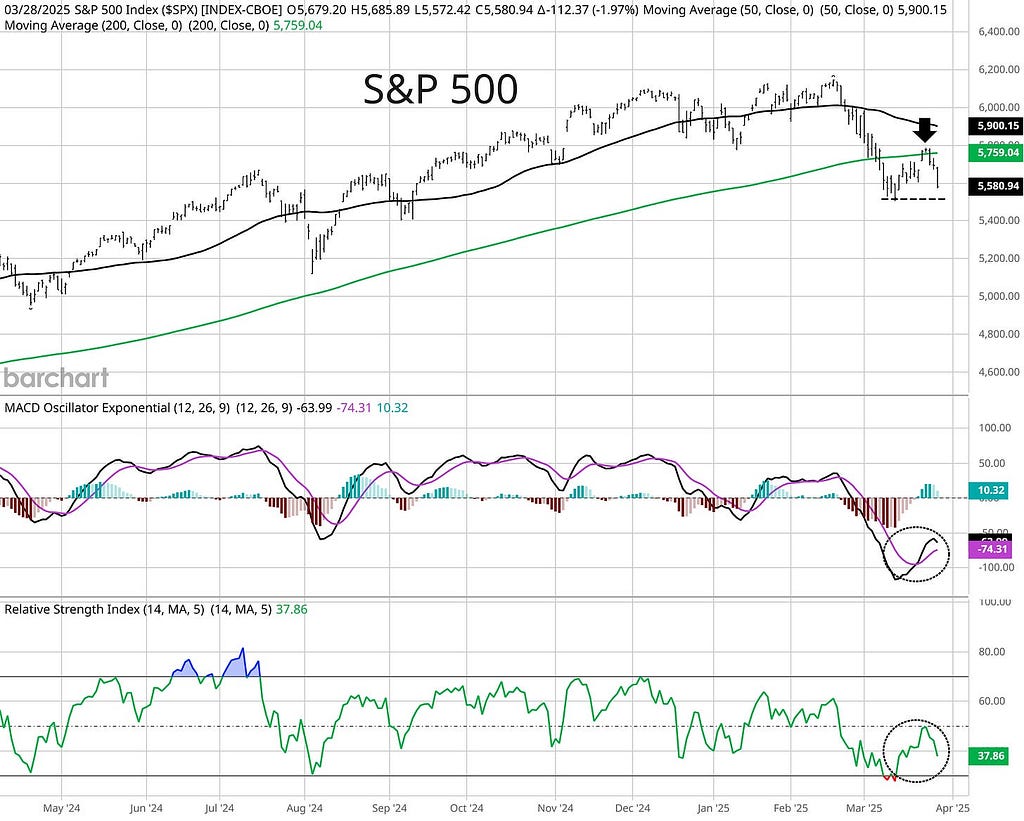
Following a strong start to the week for the S&P 500, the auto tariffs, weakening consumer sentiment, and rising inflation sent the S&P lower after testing a key level at the 200-day moving average.
While the headline news looks bleak for investors, conditions across sentiment and investor positioning remain a bullish catalyst for a rally. It will be key to watch for a retest of the March 13 lows over the coming week, and if positive momentum and breadth divergences can form for the major indexes.
Here are the critical levels and metrics that I’m watching for the week ahead, and one sector showing impressive relative strength at a time when bullish seasonality is around the corner.
The Chart Report
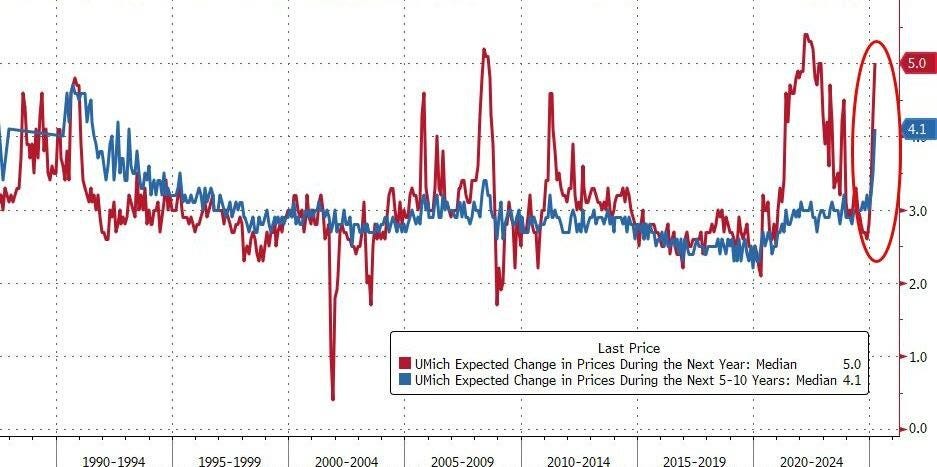
During the same week that saw the Fed’s preferred inflation gauge (PCE) rise more than expected, consumers expect far higher levels ahead. The University of Michigan’s sentiment survey also inquires about the inflation outlook. Americans think inflation will average 5% in the next year (red line below), which is up from 4.3% in February. Over the next five years, inflation is expected to average 4.1% (blue line below), which is up from 3.5% in the prior month and is the highest level since 1993.
Along with negative headlines, bearish technical conditions helped reject the S&P 500 off a key level. But those same technicals could point to a bullish momentum divergence if the S&P retests the lows. After bottoming near the 5,500 level on March 13, the S&P rallied back toward the 200-day MA which is the green line in the chart below. As the S&P tested that level from below, the MACD and RSI were both making bearish momentum resets with the MACD under the zero line and RSI holding under 50. But with last week’s drop, the S&P could retest or undercut the March 13 lows. If that happens, watch for the MACD and RSI to make a higher low which could deliver a bullish momentum divergence.
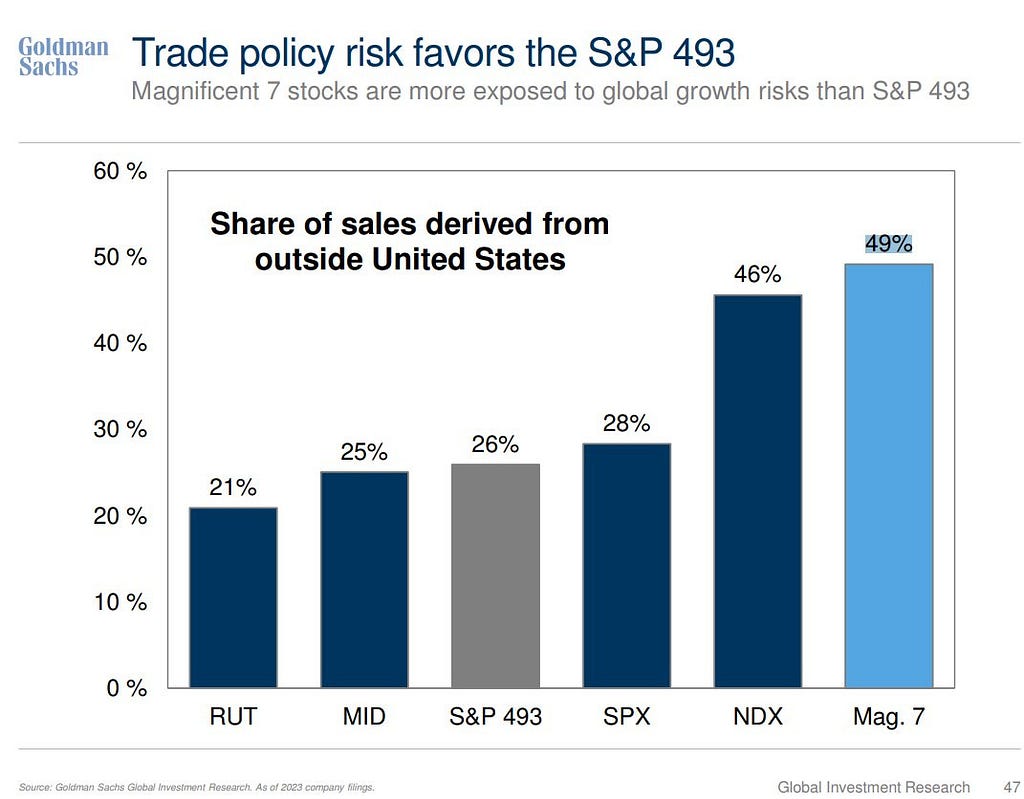
Heading into the February peak for the S&P 500, the market’s largest stocks made up a record share of the index. The “Magnificent 7”, which includes names like Apple (AAPL) and Nvidia (NVDA), are a big driver of the concentration and were responsible for 55% of the S&P 500’s 23% gain last year. But the record weighting leaves the major indexes vulnerable to downside when investor moods toward the Mag 7 sours. That’s especially the case recently since the Mag 7 carries high exposure to sales coming from international sources. The Mag 7 receives 49% of revenues from outside the U.S. That compares to 26% for the remaining stocks in the S&P (chart below). That leaves the Mag 7 more exposed to developments around tariffs and trade wars, and could also be the target of retaliatory measures from other countries.
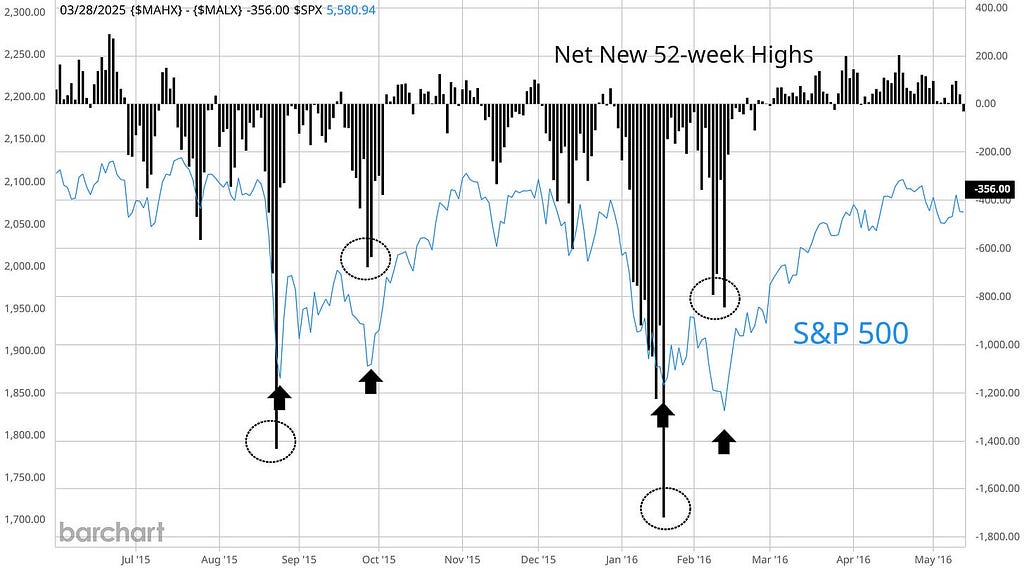
Mega-cap stocks are a major contributor to the S&P 500’s recent correction. For signs that the S&P 500 could stabilize and recover, then watch the performance of the average stock. That’s especially the case if the S&P 500 retests the March lows. One key breadth metric to follow is net new 52-week highs, which takes 52-week new highs across the major exchanges and subtracts new lows. The chart below shows net new highs and the S&P 500 during two corrections in late 2015 and early 2016. During each instance, the arrows show where the S&P 500 is retesting the low on each correction. The circled area shows shrinking net new lows on each retest, highlighting the improvement in the average stock.
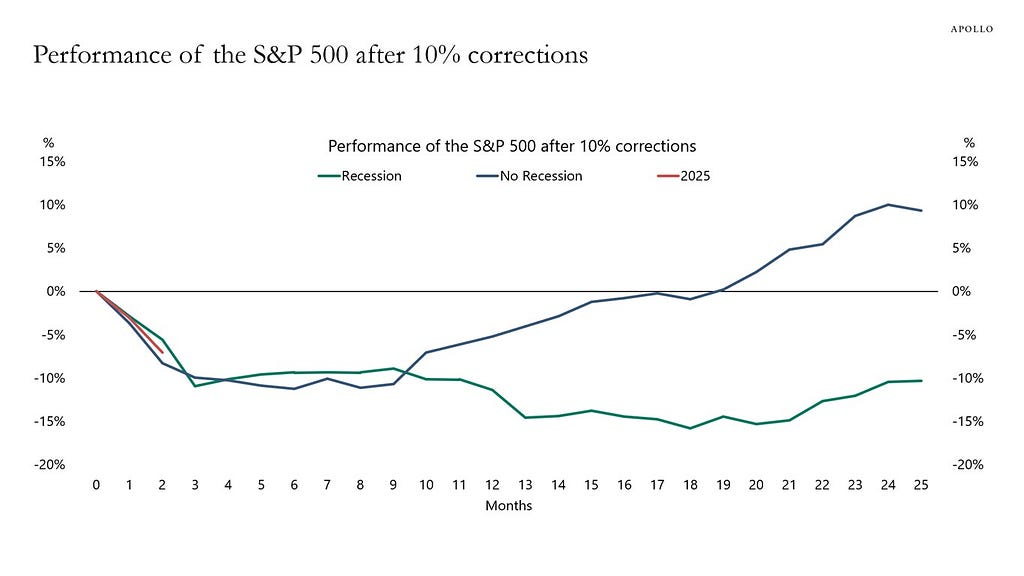
While the Mag 7 is helping drive near-term volatility, a recovery in the stock market will ultimately come down to earnings. Over the long-term, the path of corporate earnings ultimately drives stocks prices. That means the economic outlook needs to stay intact if the S&P 500 can recover following the drop into correction territory. The chart below plots the average direction of the S&P 500 following a correction, and is conditional on the economy falling into recession or not. The blue line shows the path when recession is avoided, where corrections deliver a “buy the dip” opportunity. The green line shows the path when a recession occurs, which tends to see new lows for the S&P after falling into correction.
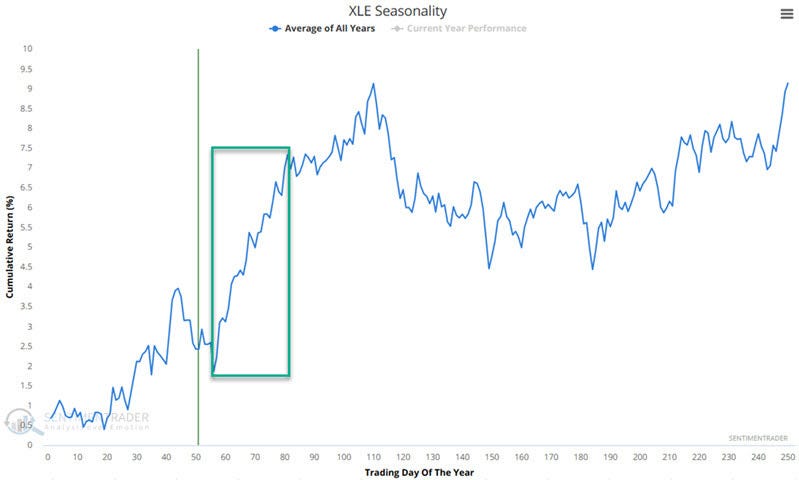
Inflation is one factor weighing broadly on stock prices, but other sectors with a positive correlation to inflation are showing relative strength. Gold prices are moving out to record highs, and the energy sector is historically among the best performing S&P 500 sectors during periods of high and rising inflation. At the same time, a period of bullish seasonality is about to hit energy stocks. The chart below shows the average movement of the Energy Select Sector SPDR Fund (XLE) during the calendar year. XLE is approaching a period of strong seasonality for the next few months.
Heard in the Hub
The Traders Hub features live trade alerts, market update videos, and other educational content for members.
Here’s a quick recap of recent alerts, market updates, and educational posts:
- Which stocks are holding up against the correction.
- Why you should focus on trading the setup instead of the stock.
- How to use repeating chart patterns to cut through noisy price action.
- Why changes in volatility levels can fuel buying and selling by large institutions.
You can follow everything we’re trading and tracking by becoming a member of the Traders Hub.
By becoming a member, you will unlock all market updates and trade alerts reserved exclusively for members.
👉You can click here to join now👈
Trade Idea
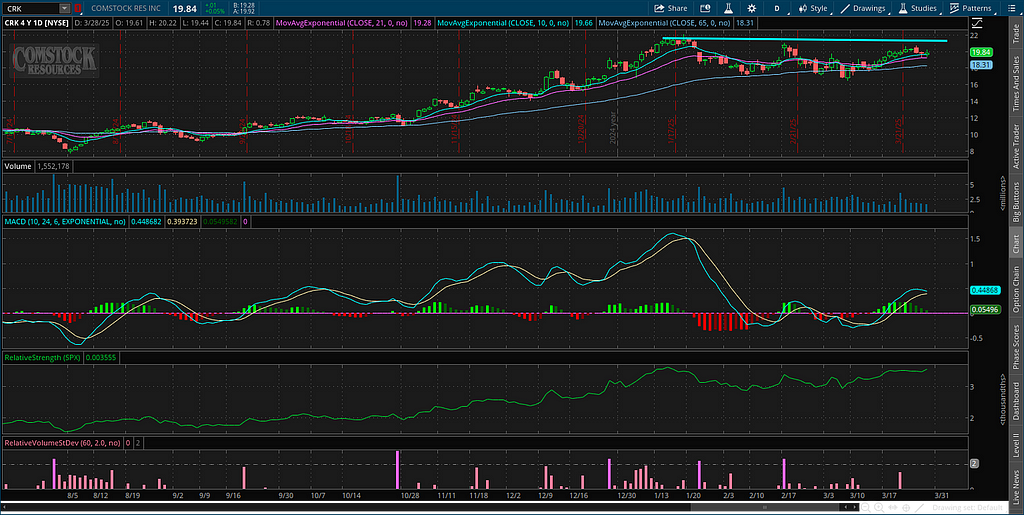
Comstock Resources (CRK)
Peaked near the $22 level in January then started a new consolidation pattern. Recently making a smaller pullback from resistance while the relative strength line (green line near the bottom panel) holds near the high. Watching for a move over $22.
Key Upcoming Data
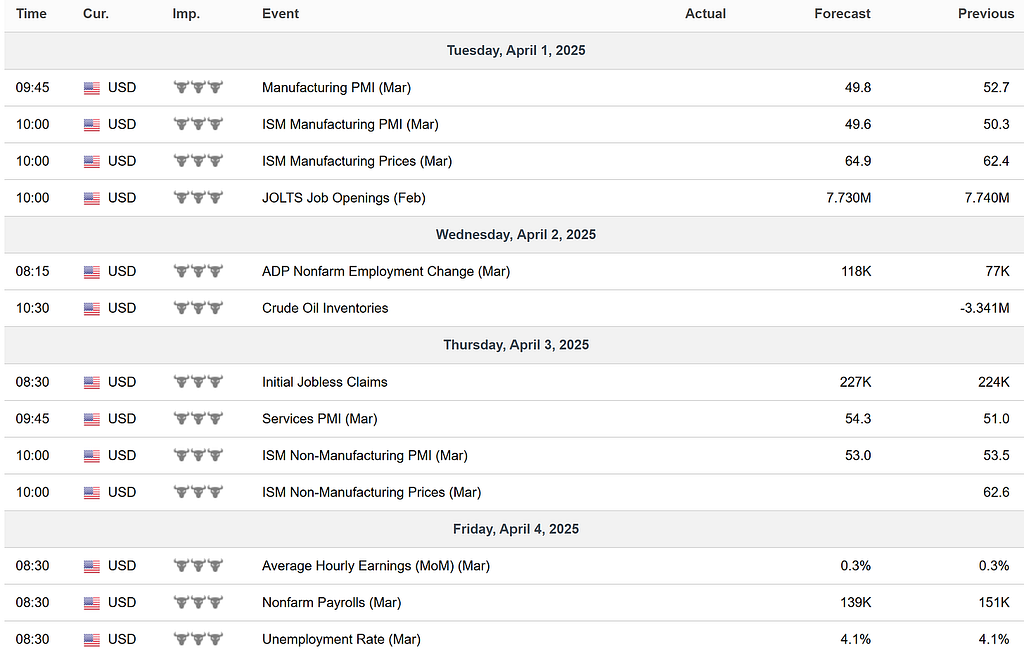
Economic Reports
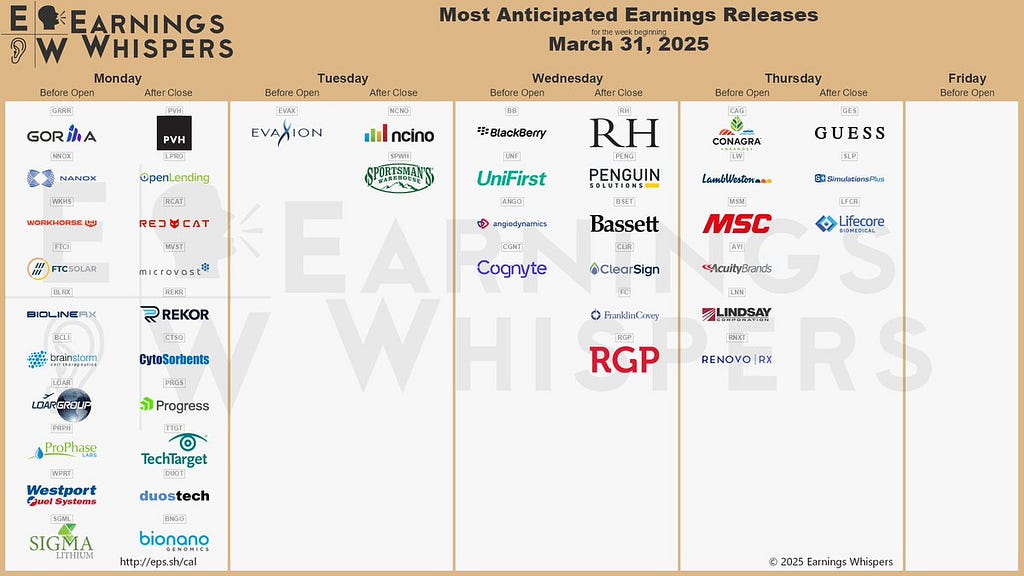
Earnings Releases
I hope you’ve enjoyed The Market Mosaic, and please share this report with your family, friends, coworkers…or anyone that would benefit from an objective look at the stock market.
Become a member of the Traders Hub to unlock access to:
✅Model Portfolio
✅Members Only Chat
✅Trade Ideas & Live Alerts
✅Mosaic Vision Market Updates + More
Our model portfolio is built using a “core and explore” approach, including a Stock Trading Portfolio and ETF Investment Portfolio.
Come join us over at the Hub as we seek to capitalize on stocks and ETFs that are breaking out!
Disclaimer: these are not recommendations and just my thoughts and opinions…do your own due diligence! I may hold a position in the securities mentioned in this report.
Watch for bullish divergences if the S&P 500 tests the lows. was originally published in Coinmonks on Medium, where people are continuing the conversation by highlighting and responding to this story.